Graphing functions
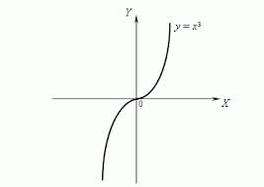 This function is the parent cubic.
Parent function equations:
- Line y=x
- Absolute Value y=IxI
- Square Root y= SQRT of x
- Cubic y=x³
- Parabola/Quadratic y=x²
- Reciprocal y=1/x
Manipulating an Equation/Graph: Transitions
Parent Graph
Line
Absolute Value Square Root Cubic Parabola Reciprocal |
Left
y = x+b
y = Ix+cI y = SQRT(x+c) y = (x+c)³ y = (x+c)² y = 1/(x+c) |
Right
y = x-b
y = Ix-cI y = SQRT(x-c) y = (x-c)³ y = (x-c)² y = 1/(x-c) |
Up
y = x+b
y = IxI+c y = SQRT(x)+c y = x³+c y = x²+c y = 1/x +c |
Down
y = x-b
y = IxI-c y = SQRT(x)-c y = x³-c y = x²-c y=1/x -c |
Applying the transitions
Examine the line equation for the function y = 2x+3. Without typing this into a calculator, we can already tell that the graph is translated left and up. If you type the equation into your calculator, you'll see that translating a line up will also translate it left. Translating a graph to the right will also translate it down, try: y = 2x-3. Why is this? In the y-intercept form of the equation, the b is the y-intercept, so as b grows positively, it makes sense that the graph would move up and as the b grows negatively, the graph would move down. The graph's x-axis intercept is also adjusted which is why there is a correlation between horizontal and vertical shifts.
You should also see a pattern for the absolute value, square root, cubic, parabola, and reciprocal translations. A "c" is required to create the translation, and to move horizontally, the "c" is included in the parenthesis and is therefore affected by the symbol (whatever it may be... squaring, cubing, dividing by 1). However, the vertical translations the symbol does not affect the "c."
You should also see a pattern for the absolute value, square root, cubic, parabola, and reciprocal translations. A "c" is required to create the translation, and to move horizontally, the "c" is included in the parenthesis and is therefore affected by the symbol (whatever it may be... squaring, cubing, dividing by 1). However, the vertical translations the symbol does not affect the "c."
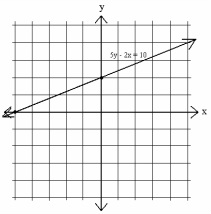 This line is a function.
Let's walk through how we would graph line 5y-2x=10. First, we should put the equation in y-intercept form so that it is easier to graph. We can do this by adjusting the equation to solve for y:
5y-2x=10
5y=2x+10
y = 2/5x+2
Now we can graph more easily. Because this line is in y-intercept form, 2 is our "b" value and therefore our y-intercept. We can make a dot at (0,2). Now we use our slope. Our slope comes before the x in y-intercept form, so our slope is 2/5. Remember that slope is rise over run. So, we'll come up with at least two more points by going up 2 and right 5. We should end up with a graph resembling the one to the right.
We can see that the graph is translated up and to the left.
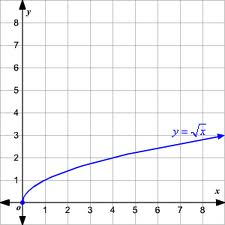 The parent graph of a square root function.
Now, let's walk through the process of graphing a square root function: y = SQRT(x+3). From our table above, we know that this graph will be shifted to the left. We must understand the domain of the function before graphing. To find the domain, we will set what is inside the SQRT equal to or greater than 0 and then solve for our domain:
0<x+3
-3<x
We now know that the graph will exist where x is greater than or equal to -3. We can now plot a point -3 and know that the graph will continue to the right. (We can do a mental check that this domain is correct by understanding that having our x-intercept be at -3 keeps in line with the fact that we know the graph has shifted to the left.)
Now we need to pick a range of values to create a table. Remember that the graph of the parent graph looks like the graph to the right, so we're looking for a version of that. Don't draw a straight line through the first three points you find! Also remember not to pick numbers less than three, and negative square root numbers cannot be graphed.
|
x
1 6 13 22 |
y
2 3 4 5 |
These points, plus (-3,0) can now be plotted. The square root function is now graphed. If we type the equation into our calculator and examine the graph, we can see that the graph is translated to the left and our domain was correct. |
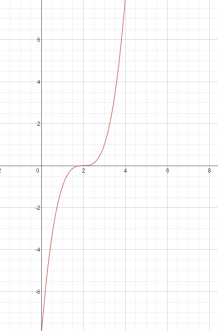 This cubic is a function. It is translated to the right.
Let's graph the cubic: y = (x-2)³. This cubic is translated to the right. We can graph the cubic by plotting 2, our x-intercept, because the number added to or subtracted from the x is the opposite of the x-intercept.
Next, we come up with a table of values:
x y
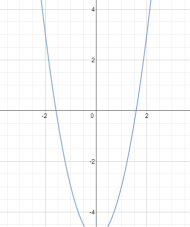 This parabola function has been shifted down.
Now, let's try to graph a parabola: y = 2x²-5. This parabola is shifted down.
We can begin by plotting the y-intercept: -5. Next, we create a table of values like we did to graph the square root function and the cubic function:
x y
We can begin by plotting the y-intercept: -5. Next, we create a table of values like we did to graph the square root function and the cubic function:
x y
