Increasing and decreasing functions
- increasing function: the y value increases as the x value increases (overall positive slopes)
- decreasing function: the y value decreases as the x value increases (overall negative slopes)
Increasing functions
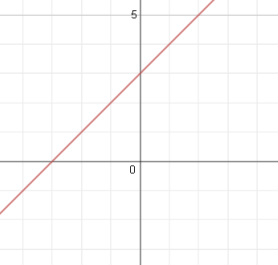 This function's graph (y=x+3) is strictly increasing.
Increasing functions can be labeled as:
- increasing
- strictly increasing
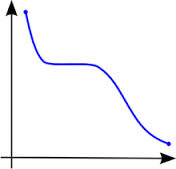
Increasing functions can have part of the graph that are not increasing (this label is correct as long as the graph tends to be "going up").
Strictly increasing means that the entirety of the graph must be "going up" at all times (no flatness or decreasing allowed).
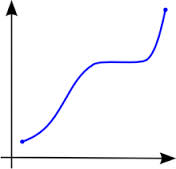
This function's graph would be labeled as "increasing" and could not be labeled as "strictly increasing" because there are parts of the graph where the y values are not increasing as the x values increase. However, the overall trend of this graph is increasing.
If you are unable to see or utilize a graph, then understand that for a function y=f(x):
For example: examine the following equation: y=2x+2.
We can come up with a few ordered pairs to check: (-5,-8), (-2,-2), (0,2), (3,8).
You can see that as the x values increase, the y values are always increasing as well. The y value is always larger than the last, so this function is "strictly increasing". We can verify our answer by examining a graph of the function (shown below).
- when x1< x2 then f(x1) ≤ f(x2) Increasing
- when x1<x2 then f(x1) < f(x2) Strictly Increasing
For example: examine the following equation: y=2x+2.
We can come up with a few ordered pairs to check: (-5,-8), (-2,-2), (0,2), (3,8).
You can see that as the x values increase, the y values are always increasing as well. The y value is always larger than the last, so this function is "strictly increasing". We can verify our answer by examining a graph of the function (shown below).
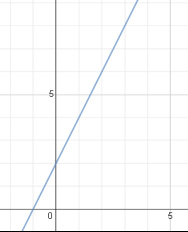
This function's graph is strictly increasing.
Decreasing functions
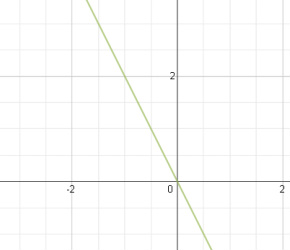 This function's graph (y=-2x) is strictly decreasing.
Decreasing functions can be labeled as:
Decreasing functions can have part of the graph that are not decreasing (this label is correct as long as the graph tends to be "going down").
Strictly decreasing means that the entirety of the graph must be "going down" at all times (no flatness or increasing allowed).
- decreasing
- strictly decreasing
Decreasing functions can have part of the graph that are not decreasing (this label is correct as long as the graph tends to be "going down").
Strictly decreasing means that the entirety of the graph must be "going down" at all times (no flatness or increasing allowed).
This function's graph tends to be decreasing so we would label it as "decreasing." But, we would not label it as "strictly decreasing" because there are parts of the graph where the y value is not decreasing as the x value increases.
If you are unable to see or utilize a graph, then understand that for a function y=f(x):
Let's classify: y=-4x+2 as decreasing or strictly decreasing (notice that these decreasing graphs have negative slopes).
We can start by finding a good smattering of different points: (-2,10), (0,2), (2,-6), (4,-14).
We can classify this graph as "strictly decreasing" because each y value is less than the previous as the x values increase. If one of the y values were the same as another, then we would have a segment of the graph that was flat and would therefore be "decreasing" but not "strictly decreasing".
- when x1< x2 then f(x1) ≥ f(x2) Decreasing
- when x1< x2 then f(x1) > f(x2) Strictly Decreasing
Let's classify: y=-4x+2 as decreasing or strictly decreasing (notice that these decreasing graphs have negative slopes).
We can start by finding a good smattering of different points: (-2,10), (0,2), (2,-6), (4,-14).
We can classify this graph as "strictly decreasing" because each y value is less than the previous as the x values increase. If one of the y values were the same as another, then we would have a segment of the graph that was flat and would therefore be "decreasing" but not "strictly decreasing".
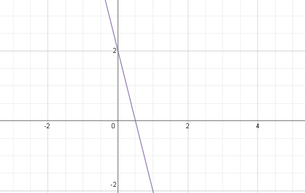
This function's graph is strictly decreasing.
All lines are either some type of increasing, some type of decreasing, or constant. A constant graph is a horizontal line (y=#) and does not increase or decrease.
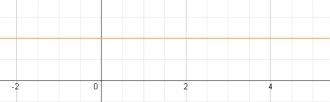
This function (y=1) is a horizontal line and is a "constant" graph, meaning that the line is neither increasing nor decreasing.
Maxima and minima
(Maxima and minima are the plurals of maximum and minimum).
- maxima = the highest point on a graph
- minima = the lowest point on a graph
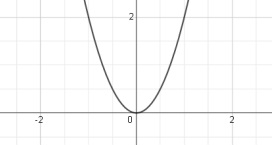
This parabola is a function and has a minimum, not a maximum because the graph has a lowest value, but not a highest (the graph's positive y values go on forever). So the minimum of this graph is (0,0) or 0. If the graph were flipped upside down, then the graph would have a maximum.
Maxima
We can say that a local maximum is the point where:
- the height of the function at "a" greater than or equal to the height anywhere else in that interval
- f(a) ≥ f(x) for all x (in the interval)
Minima
A local minimum:
- the height of the function at "a" is less than or equal to the height anywhere else in that interval
- f(a) ≤ f(x) for all x (in the interval)
You can use your calculator to estimate or check the relative maxima or minima by entering the equation into the calculator and then examining the graph. On some graphs, you may be able to see the relative maxima or minima. Otherwise, you can use the table to look at values, and if you already have found the maxima or minima, you can check your answer. There should not be any values that are greater than or less than your maxima or minima, but there could be equal values.
